Search This Blog

Saturday, July 14, 2012

Web Analytics - Boy do I have a lot to Learn

I've been involved in Marketing for over 25 years and the past 13 have focused on Banking Analytics. In February of 2011 I started a new position as Marketing Manager at an Internet Bank.  Yes this is a 100% virtual bank that was the first if its kind. People at that time thought it was cool but they didn't understand it nor did the regulators.  Interesting enough, I can honestly say I have learned more about a specific type of analytics I knew nothing about.  Web Analytics.

Every day I go to work its like I'm learning a new career every second.  I know tons about the brick and mortar world, but when it came to the web I didn't have a clue about the depth of understand this whole new world has brought to me. 

If you are a college student reading this and are interested in marketing analytics I highly recommend you find classes on the subject and take them. If you are like me, read... a lot! Read anything and everything on the subject. Google Analytics is one of the best free resources I've found. The group wants to teach a better understanding of the web to both increase their own revenue, but more importantly improve content, optimize the users experience, and your own revenue.

Google offers video tutorials, as well as the opportunity to become certified in the discipline through Google IQ.

I just highly recommend you take the time to learn. Most companies have what they believe is a web strategy and for most it is just a web presents. I'm speaking more from a financial institution standpoint. You have a website that customers can see, read information, and perform online transactions through a third party bill pay company or other such services. You may even have a the ability to open an account; however what is your strategy to drive your current or even new clients to your site?

Give it 5 to 10 years and the dynamics of transitions that evolved from in branch to drive up and then ATM traffic to all traffic being virtual.

Just think of your own bank transactions, when was the last time you went into a branch?   And even at that why did you go? I've not conducted any studies; however I could easily break it down to a number of choices for you. 1. You had a check to either cash or deposit. 2. You had cash to deposit, or 3. You applied for a loan. I could add a number 4 here and say an issue or a problem, however most find it easier and quicker to do that over the phone.

Virtual institutions can become one of your biggest enemies.  Why travel to a bank anywhere to deposit a check when with remote capture you can either scan or take a picture and make the deposit any where.  Need cash? through networking these virtual institutions can either provide rebates on ATM fees or like credit unions belonging to ATM networks allowing over 65,000 free locations globally.

So for the computer, smart phone, savvy or un-savvy going to a financial institution for any reason is  and will be archaic.

So how do you produce analytics from the web and what information can you gleam from it?

As I have said earlier Google Analytics can provide some of the best tools to track how customers are getting to you and what are they doing once they get to you. All for Free!

Some of the best statistics are; how many page views, bounce rate, or the rate at which an individual hits a page and then jumps away, and conversions.  All of these have importance and unless you set your site up correctly to track you will never obtain the information you are looking for.

Although Google Analytics is free, sometimes it is best to hire an experienced individual that can set the code correctly on all of your web pages, build a nice dashboard for you to quickly review data, and even set up alerts when traffic either increases or decreases for some reason.

I'm currently reviewing cross domain traffic.  This is where I have multiple sites that cross pollinates other divisions. I'm hoping it will tell me if the site makes it easy to jump from one location to the next. 

One piece of insight I can share is that everything on the web comes down to user experience.  How easy is it for someone to navigate and find what they want, purchase, or what ever then go on about their day.   

Google Analytics can tell you what you need to know.  How many pages does the average person have to get through just to get what they need?  Stand back and look at your own site.  Be a customer.  Is it what you want them to see or do? 

Sometimes web designers get conflicted because to increase your quality score on Google, content becomes the king.  If this becomes the driver, you'll see too much content.  When Google sends out agents or spiders to review your pages content helps as long as it is relative content on what you are offering.  But if you look at most sites there is so much there one has no clue what the offer is.  Simpler is better by far!

There are companies that you can hire, some under $30 a test, to have real people look at your website and perform a series of tasks.  It could be open a new account.  Sign up for a news letter, anything.  Then to user goes through the process seeing if it can be done.  Both audio and video is recorded.  Find one, have your own focus groups, test and continue to test and learn.

Never stop optimizing to create a better user experience.  It will result in higher customer satisfaction and in turn revenue.

If you have additional questions please email me or make a comment. 

Wednesday, September 15, 2010

Using the Herfindahl-Hirschman Index to determine the competitive enviroment.

With today's staggering costs of opening new facilities it becomes increasingly more important to do your homework prior to stepping in.  As a marketing professional having the correct tools to help evaluate instead of using intuition or your gut becomes extremely important.

Depending on your Senior Management, some marketing professionals are not even looked at to help in the selection until after the acquisition has been completed and you are asked to promote the name change or the breaking of ground.

Here is a simple tool that should be looked at first to determine market concentration of institutions and if your organization has a fighting chance.  Forget for now client concentration, financial wealth of the area, the progression of the community, and we will focus on one aspect of all of the tools that should be used.
 
(HHI) or the Herfindahl-Hirschman Index, is a commonly accepted measure of market concentration. This is used to first determine how competitive the playing arena is and if your franchise can have a fighting chance.  

This index if used properly will tell you a lot about the competitive environment.  Who are the players? What are their individual market shares? And does your operation have a chance to succeed?

There are a few pieces of information you will need in the calculation.  Gather all of the competitors, Commercial Banks, Savings Banks, and Credit Union's, obtain the current deposit balances for the area you are looking at.  Sheshunoff provides quarterly data on market share, you may need to dig a little deeper to find additional deposit information about credit unions.
Remember, deposit information within Sheshunoff is from FDIC deposit numbers which do include public funds.  If an institution concentrates on these types of deposits, or for some reason looses or exits the market you could see large fluctuations in their market share from year to year, or even quarter to quarter.  Always note this in any recommendation when referring to these numbers.
So how does one calculate the competitiveness of the market with this information?  Once you have gathered it all the calculations are simple.
First to find the market share of each is a straight forward calculation.  Add all of the deposit amounts together from each of the competitors.  Make sure you are only looking at the primary area or a branch of a larger institution.  From this total take the individual locations total and divide it by the whole.  $50,000,000 / $165,000,000 = .3030 X 100 = 30.30%.  Do this for each branch.

Remember because Credit Union and Bank data are not together you can't just use the market share data found in the Sheshunoff reports.

The next calculation is made by squaring the market share of each firm competing and then summing the resulting numbers. For example: A market consisting of four institutions with shares of 30%, 30%, 20% and 20% percent, 30 X 30 = 900 or the square root of 30.  Do this for each then add them together.  the HHI is 2600 (900 + 900 + 400 + 400 = 2600). 

The HHI takes into account the relative size and distribution of the institutions in a market and approaches zero when a market consists of a large number of institutions of relatively equal size. The HHI increases both as the number of institutions in the market decreases and as the disparity in size between those institutions increase.

Markets in which the HHI is between 1000 and 1800 points are considered to be moderately concentrated, and those in which the HHI is in excess of 1800 points are considered to be concentrated. Transactions that increase the HHI by more than 100 points in concentrated markets presumptively raise antitrust concerns under the Horizontal Merger Guidelines issued by the U.S. Department of Justice and the Federal Trade Commission. 

The example above is a saturated area, however this is not common.  Most areas you will find a multitude of companies bringing the index down.
This is but one simple method to determine if your organization can find a way in the competitive arena of the market. Other considerations you should take in account are the competitors themselves.  Have you worked against them in the past?  How strong is your brand? Is there wiggle room in the community for another institution, and most important what are the factors that will differentiate you from your competitors. 

Because you will be poaching or extracting clients from other institutions what will it take to break even or to make a profit.  Take all these components and more in consideration before your institution takes that first step.

As the marketing professional in your organization you must flex your analytical muscle and learn the methodologies to help your organization make well informed analytical decisions.

If you have additional questions about this topic or others please feel free to e-mail me or send me a comment. 

Does anyone really care as much about banking as marketers think they do?


A consumer report conducted by a watchdog organization stated nearly 40 percent of all respondents said that they will spend any where up to three hours shopping for a pair of jeans.  Conversely, less than a third admitted to spending the same kind of time weighing the benefits and selecting the correct financial products in order to make an informed decision. 

So does anyone really care as much about financial products as marketers think they do?

Consumers still find buying financial products complex and confusing, with mortgages and pensions regarded as the most difficult, according to an independent survey commissioned by the Financial Services Consumer Panel. 

In its first annual survey 'Consumers in the Financial Market' the Panel reveals that a substantial number of consumers may be vulnerable because of their lack of experience of financial products. The survey found that:

·         Most people have only purchased a limited number of financial products. While 77% have a savings account and 58% have a mortgage, other financial products have only been obtained by a minority of people. 6% of those sampled have never purchased any financial products. 

·         41% of respondents considered themselves experienced with a range of investment products built up over at least 5 years, but just under one third (29%) describe themselves as not having any money to save. The remaining respondents were either relatively new to saving (in the last year or two) or just beginning to think about it. 

·         Few consumers shop around for financial products. Two thirds of people who have obtained a financial product in the last 12 months had only used one source of information before making their decision, and 9% received no information at all. Yet most people were confident they had enough information to make the right choice.

With this lack of knowledge consumers look for convenience in their purchasing habits and these habit relate to how products are obtained.  Between 55-60% of consumers will purchase their next financial product close to a financial institution where they live.  20-25%, close to where they work. (It must be noted that large Metropolitan area are bound to a different set of purchasing habits, where work may play the dominating role.)  And last 10-15%, choose close to where they shop.

Although not specifically identified in this review a continually greater numbers of those searching for financial services are seeking accounts on the web.

·         Financial advisers play an influential role in people’s financial decisions. 53% of those who did obtain information seek advice from a financial adviser and they are often used as the sole source of information. 

·         Women are less likely than men to be 'financially savvy', less likely to be 'financially self-assured', and more likely to be ‘risk averse’. They are also less likely than men to take out investment products, life assurance savings products or personal pensions or make free standing additional voluntary contributions to a pension.  However these findings are quickly turning.

·         Single parent families are the group least likely to obtain different financial products and account for a quarter of those who have never purchased any financial products. Savings remain closely linked to socioeconomic characteristics. 

Barbara Saunders, Chairman of the Financial Services Consumer Panel says: “This research highlights how relatively inexperienced consumers are when it comes to financial products, which makes it even more important for products to be straightforward.”

With the lack of consumer interest, and possibly the lack of financial associates product knowledge, banking has increasing become more of a transaction business than fulfilling the financial consultant role.  Clients must be educated as to the benefits of future savings and financial alternatives. They must be guided through the life-cycles of financial well being.  It is for these reasons it is so important for an institution to understand their product mix, their associates ability, the sales process, and their market.

It has been written that the only way to overcome any objection is to understand both sides of the equation.  We have become so product and number driven we have clouded the driving force behind our business, helping clients fulfill their individual financial aspirations.  This can only be completed with a sales friendly knowledgeable staff, a staff willing to work hand-in-hand with a client to help achieve their dreams and not the institutions.

So if you don’t have a sales process in place, start one... Now!  It's teaching associates your products and how to listen.  If you really want to differentiate your institution be knowledge and help.  Walk away from “Welcome to our institution, can I take your order?”

If you would like additional information on the topic or have a suggestion for a future one feel free to e-mail me or leave a comment.

Tuesday, September 14, 2010

Should You Ever Use an Alternate Address when mailing?

In most institutions Marketing Customer Information File systems (MCIF) and their Core's are always in some type of conflict. Data integrity is vitally important for both systems; however your MCIF relies on the Core for accurate data. If it is not provided by core then your MCIF can only be as clean.

Most MCIF systems have the ability to move around the design of Core where multiple CIF keys are created for an individual. The system relies on many other factors to bring the data together. Understanding how both systems work and how you can leverage each strengths will only strengthen the data.

Remember that although data in MCIF is at the account level, mailings for the most part are created using household information that the Core system can not build. Specific methodologies as to how the primary account is built within your MCIF has proven to be the best means to identify the primary household address.

You must maintain the integrity of your MCIF's house holding methodology.  Most systems allow for user defined tweaking, however once you have it set refrain from ever touching it again. Every time you change it within the system all historical data can then be tossed out the door.

Check the number of address fields you bring in to your system, as well as, how many your system uses.  Most cores have multiple address lines that will include a current or alternate account addresses.  These could be address1 and address2 in your MCIF; however they are only used when there is an issue with the primary address, blank, not correct etc. With the help of your IT, determine the number of accounts with Alternates, then of those how many do you use.

Here's a big question to ask your operations group.  Does your company maintain data standards for input into your system?  With one organization I reviewed we had found that the system maintained six address fields in in the core; however operations didn't maintain or look to have ever had any standards as to what was contained in each of the six fields.

The front line had the ability to over ride the system and create new CIF keys for ever account.  It was determine that it was a faster method of entry even if the client was already a customer.Without strong data standards your Core and now your MCIF system can never get or stay clean.

With this group, those running the MCIF determined years ago, that because of the conflicts surrounding alternate addresses that when mailing, if an account in the household had and alternate, regardless of what it was, it would be excluded. This was achieved through a populated field in the Core designating an alternate address. 

If less than 10% of your accounts have an alternate address, that at any given time in a specific mailing, the numbers just would not have a significant impact to the promotion if they were not included. 

I've had marketing departments argue as to why they can't or shouldn't access these households with Alternate Addresses.  They see the Core sending out statements to multiple accounts with multiple addresses for each account, why can't an MCIF system do the same?
I'm going to first explain the issues with privacy, then we will talk about how a Core system can do it and an MCIF system can't.

Privacy:
Alternate addresses are placed on an accounts for a number of reasons.  It could be the individuals live in two different places at different times of the year.  It could be a grandparents account, however the statement goes to the son or daughter, or even to an attorney, or a trust officer.  It could even be an account for a close friend maintained by someone else.

It should never be a question as to why it occurs, however it just does.

MCIF systems, unless you only mail at the account level (which defeats the purpose of the system) can not make those types of logical/emotional evaluations of what to send to where and to whom if you are mailing at the household level.

How your Core system does it:
Because Core systems work from Account to Individual, the logic is built to send statements depending on the need and circumstance.

Examples of Core Alternate Address Types:  Check with your operations group to obtain a list of your alternate address codes.

Value that identifies the type of alternate address selected:
1) Account alternate (record code “b/” and application code NOT “90”)
2) Primary statement alternate (record code “30”)
3) Up to five additional statement alternates (record codes “1” through “5”)
4) Check alternate (record code “50”)
5) Government notice alternate (record code “70”)
6) Legal title alternate –name only (record code “90”)
NOTE: The record and application codes reside in the CIF Alternate Name/Address File . CIF alternates have a record code of “b/” and an application code of “90”

Loosely translated:

If a new account boarding data sheet shows a mailing address or PO Box
Add an Alternate Address

If the customer wants their statement sent to a difference address
Add an Alternate Address

If the customer wants additional statements sent to different addresses
Add an Alternate Address

If a customer will receive a check (interest check, club check) and wants it to go to a different address
Add an Alternate Address

If the customer wants a different address on government filings i.e. 1099's, 5498's etc.
Add an Alternate Address

If the address on the Loan Boarding Data sheet is different from the CIF key and the difference can not be confirmed.
Add an Alternate Address

If the Legal Title and address does not conform to field restrictions or system limitations
Add an Alternate Address

Because this is at the account level a person could have multiple alternate addresses on a single account and the process becomes perplexing as to which address should be used.  However a Core system can make those types of logical determinations.

Resolution:
1.)Although this is not recommend, one could bring in all alternate addresses into your MCIF, writing new interfaces to accommodate the data. Then build methodologies outside of your MCIF system in either Access or Excel to look at all address field and their core alternate code.

By having the alternate code you could NOT pro-grammatically define which address should be used, however we could identify which accounts could have issues that would then have to be resolved.

By building parameters around each product mailing you can better define, depending on the promotion, which of the addresses would be a better choice.

If an account has an active account alternate and one or more active functional alternates specified, the functional alternates override the account alternate (with the exception of legal title alternates).

Note: With the exception of additional statement alternates, you may create only one functional alternate of each type for an account; once you have created a functional alternate for an account (e.g. check alternate), the system will not allow you to create alternate of the same type for that account, unless you delete the previous alternate."

It becomes very time consuming and you will still have to determine on an individual bases when to use what.

2.) Just exclude any account with an alternate address and save yourself a ton of headaches! period!

Conclusion:
Although either way can not provide the perfect resolution you must continue to strive to keep clients from receive incorrect mailings. The last solution will provide the means, however will also reduced the number of potential clients. However it could be very insignificant.

If you move to a more sophisticated methodology outside of your MCIF to determine the correct address then the amount of time working the list will substantially increase costing more money and the loss of valuable time to market.

Each of these resolutions are not without fault, however the first can be refined over time as the technology is refined to meet the organizations needs.

One last additional thought: Depending on the number of Alternate Addresses you have within a mailing, use the clients as your control group to determine how well your household selection and promotion worked. 

If you have additional questions or would like to see other topics e-mail me or leave a comment below. 


Wednesday, September 1, 2010

How to Build ROI Models

There are many ways to produce a strong Return On Investment (ROI) model, however I’ve always asked myself how much information is too much information? It really depends on your audience. I’ve produced multiple versions of the same document for different groups some being more detailed and others just the revenue results.

I’ve been known to go extremely deep into a program if I have the time for multiple reasons. One is if I’m trying to prove a point or I feel if the program could be used in the future and we need to remember the good and the bad.

This article will walk you through all of the components I include in my models, however for each program I may add or remove items. Remember, an ROI can either make you look like a hero or someone who hasn’t a clue what they are doing. But the one thing you must always remember is that you learn each time you produce a campaign. If something doesn’t work, note it, and discuss it. Learn from your failures and don’t repeat them. Documenting and understanding why goes a lot further then trying to manipulate the data in your favor.

I’m always leery of vendors who create their own models. Because additional income can be a major motivator and sometimes their methodologies always seem to work to their advantage. How many third party vendors have you hired have come back and should you statistics that their project resulted in a negative ROI. I’ve received positive results from groups, however when you review their components they leave out or twist the data to their advantage. It may make you look great, but when finance looks at it and flaws are exposed marketing becomes the unbelieved group.  If you do have ROI's produced by vendors, have them walk you through their methodologies.  If you agree then use them.

Web analytics are a different story to themselves and I will work on a new blog specific to the subject, however for now conversions from a web page may just be a lead.  Now whether that lead has any quality or closes is a different story.  Just remember if a vendor is looking for conversion through a funnel they may be able to product results but those results most of the time do not produce revenue.  

How to Start
So how does one start? I've always felt it was important prior to any campaign to sit down as a part of the development process to determine how the program would be tracked and what the criteria would be used to evaluate the program. It is best to have someone from finance and IT in the meeting so that everyone walks out of the process on the same page. It will be a give and take meeting. Everyone has to be comfortable with the program and the expected results.

Review your MCIF system, some provide Pre ROI models allowing you to run multiple scenarios and review break-even results prior to spending any money. It's best to know ahead of time if you can produce any type of results prior to spending any money.

If you have not done so, start working on a strategic alliance with the finance group. They can be your biggest ally in the process. Don’t just take it upon yourself to devise programs because you think it is the correct thing to do. Finance will have the knowledge as to the needs of the company whether it is additional loans, or maturing CD’s or even to do nothing.
Strategies are built from needs of the institution not on the flavor of the month.

Marketing will still have total control of the project execution but it is extremely important to have the buy in up front so that everyone can agree on the results good or bad in the end.

Documentation
Every campaign should have documentation that can be filed away as to the what the program is about, the dates ran, media used, along with costs, what will be tracked and how it is to be tracked. What are all of the initiatives that the program is looking to achieve?Are there any incentives to either the staff or new customers.

This will be your overview and the first component of your document. You may feel it is just filling the page, however I’ve always found the information to be invaluable for the future.

1. Overview-Campaign Description, Run Dates, Media Used, include flights and costs.

2. ROI Methodology- I’ll provide a separate heading describing what the
program will be tracking, how and why.

3. Run Rate
One additional component should be a heading to itself that most marketers and vendors leave out is what I call a “Run Rate.” This rate is if you looked at the number of accounts acquired in a prior time period, preferably during the same month a year ago, that were opened during a non-promotional period. This becomes the baseline.

For example at any given period of time your organization will be selling product. These accounts are ones produced as a result of no promotion. So your company can do nothing and you can produce results. This is considered a Run Rate.

The philosophy is anything above and beyond this normal Run Rate will be considered the lift the campaign contributed. Always look at number of account and total deposits or balances. These two numbers when trended can help determine if you are adding more accounts at less balances or less accounts at higher balances

This component alone should bring the rest of the company on board to agree that the results you will be providing will be legitimate.

I like to provide this information both in numeric and graph form.
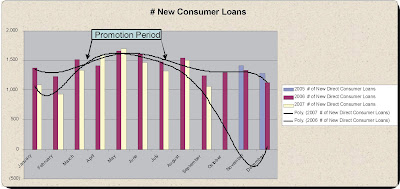
This example is a trended run rate of new consumer loans for a number of years.  Trended data can show issues in the economy or your sales process.  Use the average "Run Rate" as your base line. 
The more data that you can provide the better. I work to provide as much information as possible to the reader and myself for the future.

4. Revenue Calculation
The next component is your revenue calculation. Again you will need to work with your finance or treasury group so you can agree on the calculations.

Here are a few to discuss.

Revenue Calculation: Direct Consumer Loans
½ of face value of loan X Month Spread / 12 X the average life “with assumed pre-payment” Original Balance. Example: $50,000/2 X 3.25% / 12 months X 21 months= Life Time Value.
$25,000 X .271% X 21 months = Monthly Revenue
$67.75 X 21 months = $1,423 Life-Time Value.

Revenue Calculation: Equity Line of Credit
45% of face/2 X Month Spread /12 X the average life “with assumed pre-payment” Original Balance: $50,000X45%/2 X 3.25% /12 months X 72 months= Life Time Value.
$11,250 X .271% X 72 months = Monthly Revenue
$30.49 X 72 months = $2,195 Life-Time Value.

Note the ½ value of the lines in this example. Since it is difficult to determine the actual amount that will be used, some clients will take the entire amount and others could take months or years to use their lines. It was agreed that ½ the face value of the loan would be fair for the revenue calculation. For loans other than lines the actual balance would be used in the revenue calculation

Average Terms:
Direct Consumer Loan pay down based on 12 months of data is 58%, for an average loan life time of 21 months.

Home Equity Loan Pay down based on the same 12 months of data is 16%, for an average loan life time of 72 months.

Note: An important part of any ROI is the understand pay down or early withdrawal. Working with your finance group this amount can be used to refine your final calculations.

Accounts without Spreads:
Any client that does not have a spread associated to the loan because of no drawl or payout, the following spreads will be used.
Direct Consumer 2.5%
Equity Line of Credit 2.25%

Credit Cost:
Credit Costs will be added to provide provisions for loan loss. This percent will be multiplied by the correct portion of the face value. Equity is multiplied by ½ the Equity Lines of Credit Usage and ½ the face value of a Consumer Loan.

This amount will be calculated for each response to determine the revenue per account. The accumulation of these will be the programs life-time revenue.

You can basically do the same for deposit products determining average life of the product, spread, etc. If your average life-time is 6 years on deposit products opt for a lesser number such as 2 or 3 years. Although your results for your ROI will decline this effort will go along way in your organization acceptance to the results. Don’t leave out in the documentation the average life of the product. It will allow the reader to understand how conservative your revenue calculations are.

Document Prior to Campaign
If you have the time prepare all of your documentation prior to the campaign. It will help in the long run and speed the process. Your first document may take some time, however after you have all of the components down then for each new program you will only need to make minor changes.

Data Collection
After the campaign has run, I collect the data. Depending on the promotion I always seem to have some stragglers so at the onset we determine the cut off date for the promotion. I normally wait for a month after the campaign, however it may depend on when you update your MCIF and the competition of the campaign.

Follow the guidelines you set down to extract the data. Only the direct results are ones that I use for revenue. Indirect results those accounts that could have been a result of the campaign can be shown, however, I never use them in the revenue calculation. Make sure you note these.

There are multiple ways to grab this data, however two that I like to use are new households during the campaign that purchased the product, grab the household information and distribute by product or service. Take a snapshot and include in your documentation.

Note: This information could really be used in your ROI as revenue, however I’ve had better success in under-estimating the results allowing the reader to make the conclusion it could have been added.

The second part would be all existing households that took the product and opened additional products during the promotional period.

Note: Although the promotion could have been the determining factor for the product opening, the result of good salesmanship I have only included this data as information. Document the results the same as those for new households, however never use the data for revenue.

Results:
I produce a single Excel sheet that has my revenue and calculations embedded. This saves time so I can save a standard copy to use again. Once I have completed entering the campaign results I copy and insert the results document into my final word document.
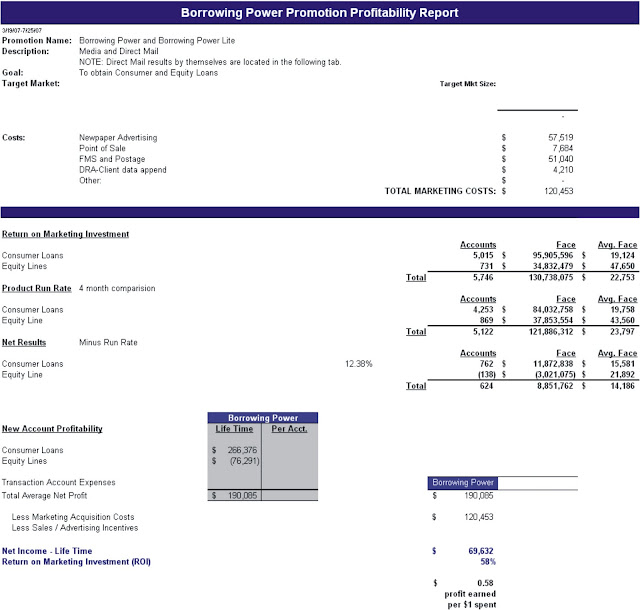
The above Excel file provides data about the campaign from expenses, income, balances, run rates applied, excluding on boarding and life time product costs. Life-time income and return on investment.
Direct mail results:
If I have a campaign that includes direct mail I provide a second document that looks at the response rate and then the product results from this group. I do not exclude any run rate unless it was only a direct mail program. This final document will provide the “results” of those that responded to the mail piece. 
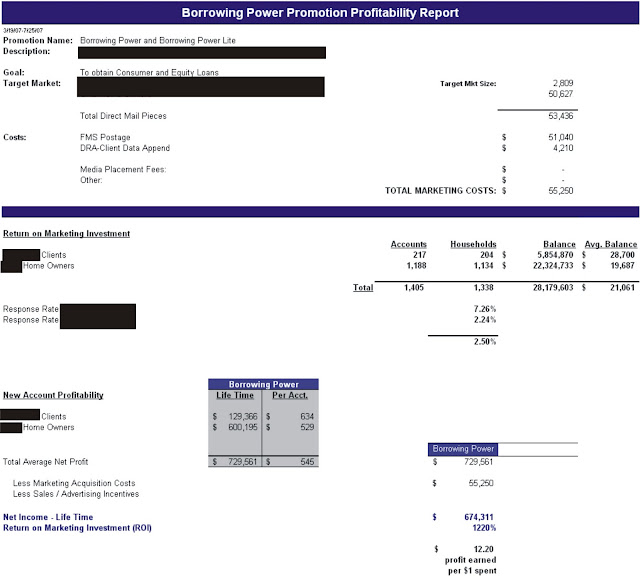
Direct mail results will be mutually exclusive however in the overall results this information has been included.  Basically the same information is made available, however no"Run Rates" are included.  Response rates are show split out if multiple product types are offered.

Now the theory here is I look at Direct Mail data mutually exclusive to the overall promotion. Even though no definitive conclusion can be made as to if the results came from the mail piece, we can provide a response rate as to those that had this media touch point. It is just a review to determine if the list was correct for the campaign. The results will already be included in the overall campaign.

You can split this data out because your direct mail costs can be separated.

Conclusion
Once you have completed all of the components you get your chance to formulate your conclusion or opinion about the campaign. This must be non-bias addressing all of the good and bad points of the program.

I always go into each ROI with the assumption the program lost money. This will allow you to look under every rock and look at the program from every angle. I have yet to find a marketing campaign that I’ve not learned something from.

Sit down with the Group
The very last component in my ROI's is the opportunity I get to sit down with those involved in the program.  Marketing, Sales, Finance, IT.  Discuss the findings.  Use this time to allow for discussion if additional input is needed.  The process will strengthen your relationship with all parties, as well as, moving your organization forward to become more knowledge. 

In the conclusion, keep in mind it is a learning process on how to build an ROI. What can you extract from the data to either exploit the positives or learn from the mistakes. Always make notes as to the economy and weather, they can have a major impact on the results. Just make sure you document those and at times include them in your conclusion.

Remember: Test and Learn
Never look at any program as a failure they are only learning experiences that can be used for the next program.
  
If you have additional questions or would like to see other topics e-mail me or leave a comment below.

Tuesday, August 31, 2010

Are You Advertising or Marketing?

Let's face it the majority of marketers in the financial industry work for smaller organizations. If you are in this category we have lulled ourselves into believing we are “Marketing”, when it really comes down to it, it is advertising and event planning.

Don’t get me wrong these aspects of the position need to be accomplished and to be quite frank are the most interesting and fun, however are you strategically positioning the organization based on analytics or just what seems to be fun or intuitive.

Here are two observations I’ve seen and ask yourself each if you have fallen victim of either. I know I have.

First: Marketing from a community, your board, and staff idea is, you are doing your job if they can see the organizations name in the public. This is accomplished either by advertising or the sponsorship of an event.

This first example is where a small shop gets trapped into shying away from being analytical because data for the most part can’t be seen by the public. Marketers receive their kudos from these three groups that see the ads or a sponsorship. So if you direct their attention to these two elements, even if strategically they are wrong, everyone believes you are doing your job.

Listen to yourself the next time you are in a senior meeting where everyone discusses what he or she is working on. 9 times out of 10 times when marketing speaks they fall back into what I call is the pretty paper and colored pen presentation. You discuss the upcoming events, ads, and how many balloons you have ordered. I've seen this even in $10 billion organizations. I’m not saying this information is entirely wrong, but I am saying the discussion should be centered on target markets and profits to strategically achieve a specific goal.

You must elevate yourself and the position to play on the same playing field as finance, mortgage, deposits, and treasury.

Second: Most marketing individuals think they are analytical, however it is only surface. They may say or have heard the correct words, but have they really looked and understood what they are reading.  Analysis really comes about through behavior sciences or how an individual’s brain functions. Marketing individuals can normally be classified as creative or right brain thinkers where analytical individuals are left brain, the part that focuses on reasoning functions. It is rare when someone has both. So if you fall in the creative right brain group just be aware its brain function and not just a lack of knowledge.

Don't stop learning to be an analytical shop just because it makes your head hurt, which I have heard. If you work hard it is possible to train your brain to even enjoy it.  Take a little time to read each of my blogs, go back to school, or just research the subject on the net.  There are some very simple tools or at least knowledge components that can help you become an analytical marketing professional and more desirable in the work place.

This blog is here to help you focus on this other side, the analytical marketer, to go back to the basics of what marketing positions itself should be, however using the fun aspects of the position to execute the strategies that will differentiate your organization from your competition…and to be quite honest differentiate yourself for a brighter future.


If you have additional questions please feel free to e-mail me or just leave a comment.

Sunday, August 29, 2010

Single Service Households

If you have spent the time to read a prior article on Service Per Household you will find a case study that notes it is not prudent to use the measurement of SPH to drive your institution. However by collecting this data there is a portion of the information that is extremely important to all institutions.

Single Service Households or those clients that only have one product type with you have a more likely chance to leave your organization.  So likely that a single service client has an 80% more likely chance of leaving your institution within the first 12 months.  It is very important to begin an engagement program as soon as possible.

However before we get to marketing programs let us first work to determine what percentage of clients you have that are single service.

Most if not all MCIF systems will have built in reporting tools that will extract this data quickly and efficiently.  If you know how build it, and more importantly building in a batch function that will allow you to obtain the data each month, go for it.  But if not my suggestion is to contact your vendor or read your manual.  The best results will be by company and then by branch, then the most important, monthly trends along with branch ranking.  Each of these will serve a very important role in your analysis.

As a NOTE: If you are proficient with your MCIF you should run some preliminary cleansing filters prior to finishing the output.  I have learned from experience that data is never clean and if you are going to obtain accurate information sometimes you must dig deep to understand what is being provided and even if it is correct.  

Take for instance single service households that just look odd.  Review those products that must have an association with another just to be legitimate.  For example: Single Service Bill Pay, Internet Banking, an ATM or Debit Card.  Each of these must have an association with another account and if they are not then some type of anomaly has occurred.

Run a simple household report extracting these very products and services by household where total services = 1 and service type = any of the above.  What are the counts? Try to determine how this could have occurred.  For us this was a normal occurrence and here is why.

Say a spouse comes in and changes the address on several accounts.  If there are two names on the account on of the individuals has authority to make the change.  As for these other types of accounts ATM, Debit, etc., they are owned by a single individual and federal regulations require a signature of the change for each. Was a signature card ever given?  Was one given but never returned?  These two scenarios result in all other information being changed with the exception of the other spouses because of the lack of a signature.  The next time you update your MCIF the addresses will not match and a new household is created for the orphaned account, making it a new single service household.

Anomalies will occur and they need to be fixed, however they will continually plague you data.   Make your group aware of the issues, and then move on.  The best resolution is to exclude these from your data.  Add this exclusion criteria in your batch.

Once the data is available you may find some very staggering results.  I've heard of organizations with single service households compiling more than 60% of their over all client base.  Going back to what I noted earlier that single service households have an 80% greater chance in leaving your organization within the first 12 months.  Unless you just love to do nothing but acquiring accounts getting a handle on this number by branch will be extremely important.

I'd say the average should be from 40% to 50%, however with a concentrated effort over years that number can come down.  With my prior employer we had managed to get that number in the low to upper 20's.

So how do you go about fighting these numbers?  First clean up your messes and second begin a sales culture that requires associates to ask for the business.  Third as a marketer that owns an MCIF system simple mailings to new and existing clients on an array of your product offerings will get the ball rolling.

I would suggest you build reports and begin sales initiatives that look at SS households with checking.  These should be offered, ATM or Debit Cards, or even Internet Banking or Bill Pay.  These may not produce revenue for your organization, however it will produce a sticky value that will retain that customer longer.

New households no matter if they are single service or not should always be contacted to increase cross-sell.  If you own a Matrix Mailing component make sure you set this tool up to monthly or quarterly contact your single service clients.

If you are diligent over time these numbers will come down and your associates will begin to understand their work will become easier.    

Once you have a year or so under your belt, trend results hopefully will see improvements.  Ranking branches can be very important to determine those locations that have issues.  Take the bottom 25% and dig into the data more.  See why there are issue.  One of the best ways to analysis your branch network is by observation.  Hang out at the branch, watch the interaction, see if other services are offered to the client, help where you can.  If you can bring the bottom 25% up your averages will climb at a good pace.

Good luck!

If you have additional questions about this or any other topic please send me an e-mail or leave a comment below